LogicManager Risk Metrics & Dynamic Dashboard Examples: Free Download
Take a look at some of our software’s key reporting features.

If a picture is worth a thousand words, then data visualization is key to telling the story of an ERM program. Metrics and reporting support the value of ERM, as well as the degree to which previously unidentified risks have been mitigated.
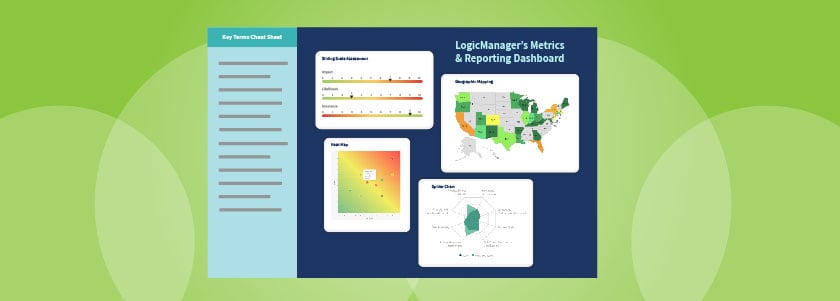
Take a look at a few examples of LogicManager’s reporting capabilities by downloading our Metrics & Reporting Dynamic Dashboard. It offers a cheat sheet of key reporting terms, as well as a complimentary visualization of our:
- Sliding scale assessment
- Geographic mapping tool
- Heat map
- Spider chart
Use the form to download your copy of the dynamic dashboard now!
